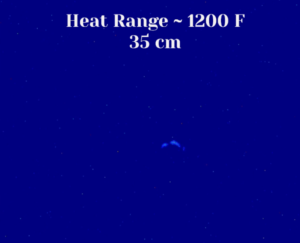
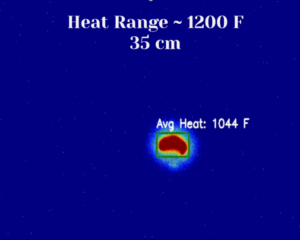
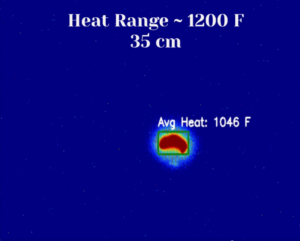
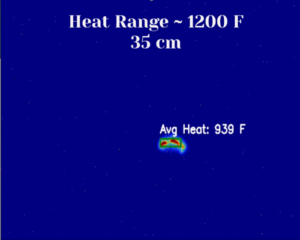
Heat measurement in this algorithm is performed by processing a 16-bit grayscale thermal image and mapping its intensity values to real-world temperature readings. The function first converts the raw pixel values into grayscale intensity, normalizing them within a specified temperature range (e.g., 70°F to 1200°F). To enhance accuracy, it calculates the average environmental temperature and determines a dynamic threshold based on the 99th percentile of intensity values, filtering out noise. Using OpenCV, the grayscale image is converted to an 8-bit format, and a binary thresholding method is applied to identify significant heat sources. The algorithm then detects heat regions by finding contours and filtering out small areas below a minimum region size. For visualization, a colormap (Jet) is applied, where heat sources are highlighted in colors corresponding to temperature levels. Bounding boxes are drawn around detected heat regions, and the average and maximum heat values for each region are calculated and displayed. To provide a reference scale, a heat intensity bar is generated on the right side of the image, annotated with temperature labels. Finally, the processed heatmap is converted into a WriteableBitmap for display in the GUI. This approach ensures accurate heat source identification and visualization, making it useful for applications such as thermal imaging, industrial monitoring, and safety inspections.
- Date: January 25, 2020
- Categories: ImageImage Processing & Computer Vision
- wannakorn sangthongngam Heat Measurement